
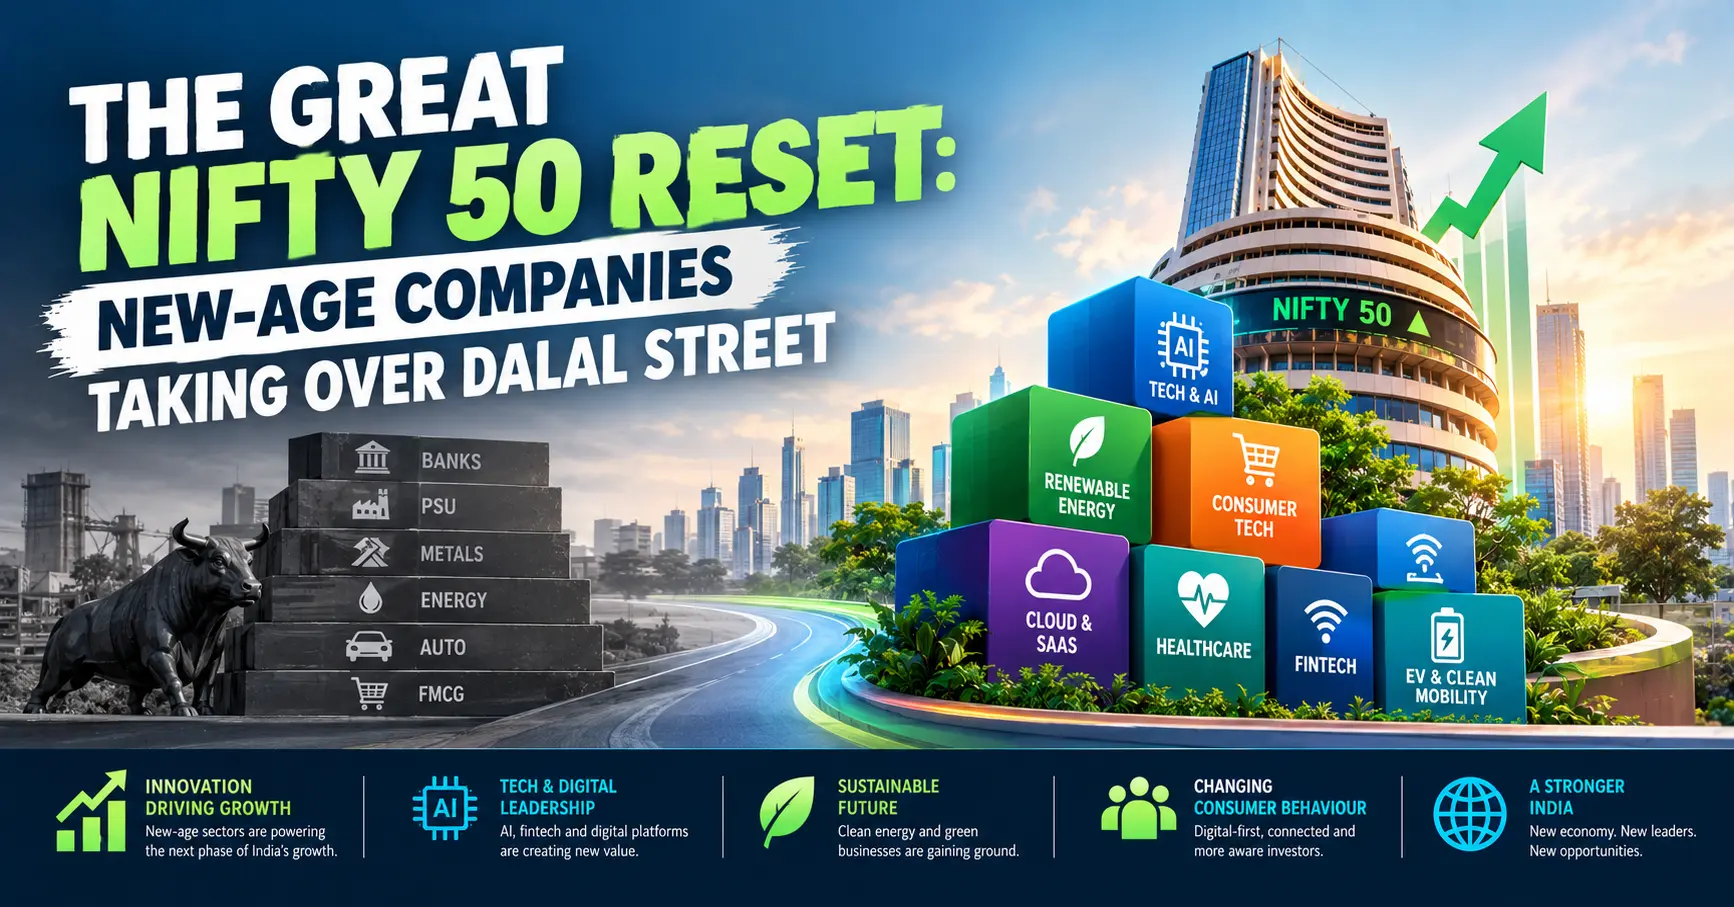
THE S&P 500 HAS BEEN RESET BEFORE AND IT CHANGED THE FACE OF WALL STREET
Index is not a static portrayal of the economic landscape. With time, industries will grow, decay, and give way to new ones. The S&P 500 index illustrates this evolution well. The main thing about it is not just the replacement of old companies by new ones; what matters is the changing structure of the economy which this index reflects.
Such considerations are equally important in relation to the future of the Indian Nifty 50 index. Before looking into the possible structure of the companies which may determine the future of this index over the coming years, it is necessary to analyze how a leading global benchmark such as the S&P 500 evolved amid the evolution of the US economy from industrial to technological.
1957–1980s: When Industry Defined the Index
With the introduction of the S&P 500 in 1957, many industrial firms were included in the index, as they represented the type of companies that comprised the US economy at the time. Factories, steel mills, oil companies, and other industrial firms were integral parts of economic growth and activity. Therefore, the index was strongly connected to the real economy, with industrial production and infrastructure playing a crucial role
However, as the years went on and the US economy evolved, so did the companies in the S&P 500. Energy received prominence during the oil shocks, whereas technology slowly but surely transformed from a minor sector in the market into a major one.
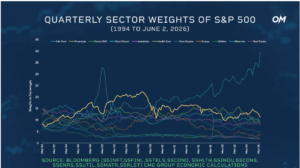
It is worth noting that this transition took a considerable amount of time and was the result of technological development, evolution in consumer habits and needs, and emergence of whole new markets. Some of those emerging sectors evolved to form companies large enough to influence the index.
1989–2000: The Acceleration Phase
The late 1980s and 1990s marked the acceleration of this transition. In December 1989, Telecommunication Services represented approximately 9% of the S&P 500; by 2017, its weight had fallen to just above 2%. At the same time, technology companies were becoming increasingly important. The decline of one economic segment and the rise of another changed the character of the benchmark.
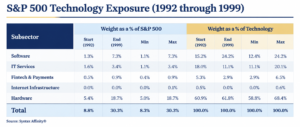
The technology build-out became particularly visible during the 1990s. Technology exposure in the S&P 500 was around 9% at the beginning of 1992 and reached about 30% by the end of 1999. Hardware dominated the technology complex during this period, while software also increased its representation. By the end of 1999, Microsoft, Cisco, Intel, Lucent Technologies and IBM together accounted for about 13.7% of the S&P 500.
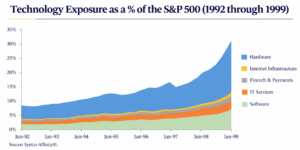
The composition of technology itself is also important. In 1999, network equipment and servers were the largest hardware segment. Enterprise and application software dominated the software category, while search, social networks and gaming were still tiny parts of the index. Even within a rising sector, the eventual dominant business models had not yet fully emerged.
2000–2009: The Bubble Burst but the Structural Change Continued
The technology bubble created a sharp valuation cycle within a much larger structural transformation. After the March 2000 peak, technology exposure in the S&P 500 fell from roughly 30% at the beginning of 2000 to about 16% by September 2002. Hardware experienced the sharpest decline, particularly in network equipment and servers.
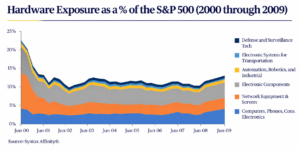
But the collapse of the dot-com bubble did not reverse the underlying technological transformation. Instead, the composition within technology began to change. By the end of the decade, electronic components and computers, phones and consumer electronics had become more important within hardware. Software also evolved, with web-based retail and distribution beginning to gain ground and gaming, social and search networks expanding their presence.
This distinction is crucial. A sector can experience a valuation collapse without the underlying economic transition disappearing. The dot-com bubble ended, but digitisation continued.
2010–2022: From Technology to Software, Cloud and Digital Infrastructure
The next decade produced a different kind of technology expansion. Total technology exposure in the S&P 500 rose from about 23% at the beginning of 2010 to 37.5% by September 2022, after peaking near 42% in 2021. The composition of technology also changed: software became a much larger component, while internet infrastructure including cloud computing and data centres emerged as a meaningful part of the index.
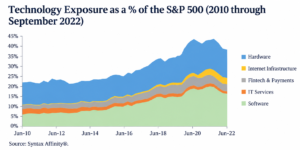
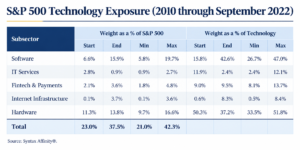
This is the broader lesson from the American experience. The index did not become a technology benchmark because the index committee suddenly decided to replace traditional companies with technology companies. Companies associated with new economic trends became larger, their market capitalisations increased, and a market-cap-weighted benchmark naturally gave them greater representation.
The transformation, however, also came with a valuation cycle. By March 2000, several of the largest technology companies were trading at exceptionally high earnings multiples, and the subsequent correction destroyed trillions of dollars of market capitalisation. Structural transformation and valuation expansion were therefore related, but they were not the same thing.
The Lesson for India
The S&P 500 experience gives us a simple framework: economic transformation creates new industries; successful companies within those industries grow; their market capitalisations rise; and a market-cap-weighted index gradually allocates more weight to them. Over a 10–20 year period, the benchmark can therefore come to represent a very different economy from the one it represented at the beginning.
That brings us to India. The question is no longer whether the Nifty 50 can change its history already proves that it can. The more interesting question is whether India’s economic transformation over the next decade can create a new generation of companies large enough to change the composition of the Nifty 50.
PART II THE NIFTY 50: FROM INDIA’S OLD ECONOMY TO THE INDIA OF 2035
The Nifty 50 has been evolving for three decades. When the index was launched in 1995, its composition reflected the structure of India’s economy at that time. Three decades later, financial services, information technology, energy, automobiles, consumer businesses and telecommunications occupy a very different share of the benchmark.
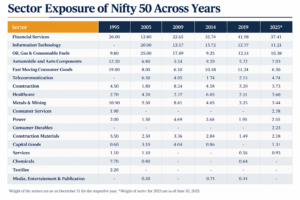
The change is visible at the sector level. Financial Services increased from about 20% of the Nifty in 1995 to more than 36% by 2025. Information Technology, which was effectively absent at the beginning, became one of the largest sectors. Oil, Gas and Consumable Fuels also changed substantially in importance, while sectors such as Telecommunication, Healthcare, Consumer Services and Consumer Durables gained representation over time.
The evolution of the index can also be seen through its constituents. Twelve companies shown in the historical Nifty exhibit have remained in the Nifty 50 from inception through June 2025: HDFC Bank, HDFC Ltd., ICICI Bank, State Bank of India, Larsen & Toubro, Reliance Industries, Hindalco Industries, Tata Steel, Tata Motors, Hindustan Unilever, ITC and Bajaj Auto. HDFC Ltd. later ceased to be a separate constituent following its merger with HDFC Bank.
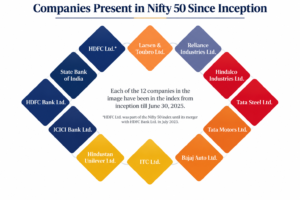
This persistence is important, but so is the turnover around it. The Nifty is not simply a basket of the same companies that happened to be large in 1995. It has gradually incorporated the industries and business models that became more important to the Indian economy.
What Does the Nifty Represent Today?
By June 2025, Financial Services accounted for about 37.4% of the Nifty 50, followed by Information Technology at 11.2%, Oil, Gas and Consumable Fuels at 10.4%, Automobiles and Auto Components at 7.0%, and Fast Moving Consumer Goods at 6.5%. Together, these five sectors represented roughly two-thirds of the index.
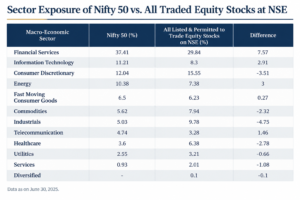
This concentration matters because the performance of a market-cap-weighted index is heavily influenced by the earnings and valuation cycles of its largest sectors. If the largest sectors continue to compound earnings rapidly, their weights can remain dominant. If their growth moderates while smaller sectors and emerging businesses grow faster, the relative weight of newer economic engines can gradually increase.
The Nifty Is a Mirror of the Economy but It Is Not the Entire Economy
The current Nifty therefore provides a snapshot of the India that has already become large enough to dominate public markets. Financialisation, IT services, energy, automobiles and mass consumption are major pillars of listed India. But the broader listed market contains many other industries whose representation in the Nifty is still relatively small.
That difference creates the central question of this article. If India’s economic structure continues to broaden toward capital markets, digital consumption, manufacturing, defence, power infrastructure, healthcare and other new business models will the Nifty 50 of 2035 still look like the Nifty 50 of 2025?
Experts told CNBC that large-cap stock indexes such as the Nifty 50 are heavily concentrated on stocks of financial services and IT companies, which do not capture heightened economic activity in emerging sectors such as manufacturing, fintech and consumer tech.
Large banks in India are taking fewer lending risks, while non-banking financial companies, which are underrepresented in the Nifty 50, are extending loans to unserved segments such as micro-enterprises, rural consumers, and used-vehicle buyers, several experts said.
IT service companies, meanwhile, are facing revenue and margin pressure amid global AI adoption, they said.
IT and financial services firms together make up about 45% of the Nifty 50′s weightage. Since the start of the year, the Nifty Bank index has declined more than 12% so far this year, while the Nifty IT index is down nearly 18%.
The story of India’s economic performance is moving outside of the large-cap benchmarks and more into mid- and small-caps, Garima Kapoor, deputy head of research and economist at Elara Capital
Underlying shift
India’s recent success in electronic manufacturing has also not been captured by top indexes. Earlier this year, India became the world’s second largest mobile manufacturer, with more than 300 production units as compared to just two in 2014.
Electronic manufacturing companies such as Dixon Technologies and Amber Enterprises, whose stocks are up 20% and 16% since the start of the year, are not part of the benchmark stock indexes.
Mid-cap and some small-cap stocks “have greater exposure to manufacturing, fintech, consumer technology, and other emerging sectors that are capturing a growing share of economic activity,” Mohammad Hassan, head of APAC equities dividend forecasting at S&P Global Market Intelligence, told CNBC
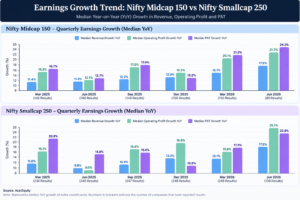
The average earnings growth of Nifty 50 companies was 18% in the June quarter, while mid-caps reported 31% growth from a year ago, according to data shared with CNBC by Indian broking firm Ambit Capital. In the financial year ending March, profits of Nifty 50 companies rose by an average of 12%, while those for Nifty Midcap 150 grew by 21%.
The capex of listed Indian companies has more than doubled to 14.5 trillion rupees ($152.6 billion) over the last six years ending in March 2026, Ambit Capital said in a report in August. The share of mid-cap companies in that has increased to 20% from 14% while that of 100 large-cap companies has fallen from 78% to 72%, the report showed.
As a result of these shifts, in the last year, while the Nifty 50 has declined by more than 14%, the Nifty Midcap 150 index is up 8%.
Midcap and small cap indexes are “more direct proxies for domestic economic acceleration,” and a growing number of these firms are crossing major market cap milestones of $1 billion. “A large part of India’s economic activity comes from sectors and businesses that are either unlisted or have limited representation in the major equity indices.
PART III THE NEXT RESET: WHERE COULD INDIA’S NEW ECONOMIC LEADERS COME FROM?
THE NEXT RESET: WHERE COULD INDIA’S NEW ECONOMIC LEADERS COME FROM?
While the upcoming reset of the Nifty 50 might not come from a rapid downfall of the existing market leaders, it can very well come from a gradual evolution of India’s growth story to cover new industries that will have companies large enough to be included in the index. This trend is currently visible even among non-Nifty 50 stocks. For instance, in Q4 FY26, the Nifty 500 saw a YoY earnings growth of 14.3%, with 21 out of 29 sectors showing double-digit growth. The growth is not confined to large caps, as the Nifty Midcap 150 and Nifty Smallcap 250 reported 15% and 13% YoY revenue growth, respectively.
Among the best illustrations of this trend are manufacturing and electronics. India’s electronics manufacturing sector is slowly moving beyond simple assembly and towards components manufacturing and more value-added production. This includes companies like Dixon, Amber, Syrma, Kaynes, and Tata Electronics, while the Electronic Components Manufacturing Scheme of the government supports the industry at large.
The significance of this transition lies in the fact that many of the players in this build-out of manufacturing are currently not part of the Nifty 50. The key question, therefore, lies in whether the current index reflects the actual growth story being played out here.
There is a parallel movement taking place in terms of the investment spending of private companies. Reuters reports that private sector capital spending was up 11.9% YoY in Q1 FY27, and gross fixed capital spending had increased to 34.3% of GDP from 31.4% in the year-ago quarter. There is an increase in the flow of capital investments in sectors such as semiconductors, electronics, data centers, aerospace, and advanced manufacturing. Capital spending on listed firms increased 11% in FY26, according to Reuters, citing Citi data.
This trend could give rise to a new generation of large-cap companies in sectors like industrial technology, power infrastructure, defense, electronics and digital infrastructure.
It is also evident that value creation through the market itself is becoming increasingly distributed. Data from NSE indicates that the share of Nifty 50 in the total market capitalization on the NSE has dropped from 58.8% in March 2020 to 43.8% in March 2026. On the other hand, the share of mid-cap, small-cap, and others has gone up.
It is not suggested here that each mid-cap or small-cap company will eventually join the Nifty 50 index. Instead, the implication is a structural change where an increasing share of market value created in India’s listed market is taking place outside the benchmark constituents.
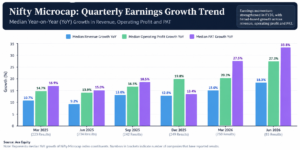
Earnings data confirms the same argument. NSE Q3 FY26 review showed that companies that are not part of the Nifty 50 but are part of the Nifty 500 had revenue growth of 10% YoY. Further, Nifty Midcap 150 had revenue growth of 14%. Earnings breadth was also improving in the broader market. As per HDFC Mutual Fund’s Q4 FY26 review, earnings of Nifty 500 had grown 14.3% YoY in the financials, consumer discretionary, metals, healthcare, and utility sectors.
It is here that the Nifty Next 50 comes into play. This index comprises the 50 firms from the Nifty 100 Index that lie outside the Nifty 50 index, thus acting as a bridge between the two indexes. NSE states that it is the next level of large-cap stocks, and companies have the potential to move into the Nifty 50 if their market capitalization, liquidity, and other eligibility criteria improve.
In the future, the next evolution of the Nifty 50 index may very well be driven by the industry sectors that become the sources of India’s new capital creation. Sectors like electronics manufacturing, semiconductor manufacturing, defense & aerospace, data centers, industrial technology, financialization and specialized manufacturing could be considered.
The idea is not to predict which specific company will make its way into the Nifty 50 index. The key takeaway here is to understand the overall message being conveyed. As earnings, investments, and market capitalization increase in newer industries, the composition of the Nifty will surely follow suit.
The Nifty 50 is not a permanent list of India’s economic leaders. It is a snapshot of the country’s largest and most liquid listed companies at a particular point in time. As India’s economy changes, the benchmark will change with it.
Conclusion
- The Nifty 50 is not a static representation of India. As the economy changes, new industries grow and successful companies become larger, the index gradually changes with them.
- India is already showing signs of another structural shift. Manufacturing, electronics, defence, power infrastructure, data centres, specialised manufacturing and financialisation are attracting increasing capital.
- The Nifty Next 50 provides the natural pipeline. These are companies just outside the Nifty 50 that can move into the benchmark as their market capitalisation and liquidity increase.
- The key takeaway: the next Nifty reset does not require today’s leaders to disappear. It can happen simply because new businesses grow faster, become larger, attract more capital and eventually gain greater representation in the index.
- Ultimately, the Nifty 50 does not determine India’s economic future the changing Indian economy determines what the Nifty 50 will look like.
If you need guidance on how to start your stock market journey, how much capital is enough to begin with, how to do smart investing, or how to take informed stock market decisions, you can join Strategic Alpha’s ‘The Conviction Club’. This is a membership program, especially curated to help investors become aware and knowledgeable about stock market trends, news, and technical aspects, so that they can become their own experts.
Our YouTube channel, weekly webinars, and digital resources available on the website can help you learn the basics of the stock market. For regular updates on trends, one-to-one sessions with experts, and detailed learning modules, you can join the Conviction Club, which is the online community of like-minded investors sharing knowledge and thoughts to grow together.
Subscribe to the Strategic Alpha Newsletter now to get the latest updates about weekly webinars.
Join Me On My Telegram Channel Where I Share Much More Value Adding Knowledge Of Investing/ Trading: Click Here
Also, Don’t Forget To Follow Us On Our Social Media Accounts:
Facebook: https://www.facebook.com/strategicalpha/
Instagram: https://www.instagram.com/strategicalpha/
Twitter: https://twitter.com/suyog_dhavan
YouTube: https://bit.ly/2IIqztO
Disclaimer: Strategic Alpha and Suyog Dhavan are not SEBI-registered investment advisor. The content provided is purely for educational purposes and should not be construed as financial or investment advice. Viewers are encouraged to conduct their own research or consult with a SEBI-registered professional before making any investment decisions.