
BROKING
1. The Evolution of the Indian Broking Industry: From Relationship-Based Brokerage to Technology-Led Financial Platforms
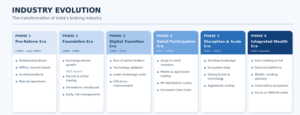
Historically, India’s broking industry consisted mainly of traditional brokers, and only wealthy investors traded in the market. Commissions for transactions were the main revenue streams for brokers, and hence the revenue depended on the number of transactions conducted by them.
However, electronic trading, dematerialisation, and digitisation brought about a change in the industry. The use of e-KYC through Aadhaar cards, UPI, and trading on mobile phones after 2015-16 drastically reduced the cost of opening a trading account. Hence, technology-oriented discount brokers have been able to provide access to capital markets, especially first-time traders in Tier-2 and Tier-3 cities.
The extent of transformation can be seen by the rise in the number of demat accounts. Total demat accounts in India rose from around 4 crore in FY20 to above 22.4 crore in FY26. Similarly, Unique PAN registrations on the NSE rose from around 4 crore in FY20 to almost 12.9 crore in FY26. Thus, technology has transformed stock market investments from a selective financial activity to a mass-market activity.
Consequently, the nature of the competition has evolved. Three major players, Groww, Zerodha, and Angel One, together account for 55-60% of the total number of NSE active clients in FY26, suggesting greater consolidation. In the same span of time, the market share of Groww has risen from zero to 28.3%, while that of Angel One has risen from 5% to 14.8%.
2. Why Is the Industry Moving Beyond Traditional Brokerage?
The classic broking approach was transaction-based income, depending on how many clients traded and the rate of transactions. Discount brokers led to the compression of brokerage margins because of the zero-brokerage delivery system and the flat rate in intra-day and derivative trading. Though more customers joined trading, the income per deal became smaller, creating more competition. Furthermore, the regulation in the derivatives markets in 2024-25 affected trading activity as well, speeding up the search for new sources of income.
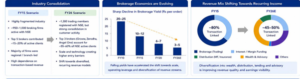
The revenue mix in the sector has therefore begun to change. The contribution of pure transaction/research revenue from the leading broker’s revenue exceeded 80–85% in FY20 but dropped to around 55–65% in FY26. The rest of the contribution comes from MTF interest income, mutual fund distribution, depository income, and other financial products.
The significance lies in the fact that the brokerage business is cyclical, while others have recurring income streams.
3. Margin Trading Facility: The Emergence of a New Structural Profit Pool
One of the most important products driving the transformation of the broking industry is Margin Trading Facility (MTF).
MTF allows an investor to purchase shares by contributing only a portion of the transaction value, while the broker finances the remaining amount. In return, the broker charges interest on the funded portion of the transaction.
Unlike traditional brokerage, which generates revenue when transactions are executed, MTF generates interest income as long as the customer maintains the funded position.
The attractiveness of this business has increased because traditional brokerage yields have compressed and the regulatory environment has become more restrictive for certain derivatives-related revenue pools.
The growth in MTF demonstrates the scale of this transition. The industry’s MTF book increased from approximately Rs. 24,920 crore in FY23 to Rs. 1.52 lakh crore in August 2026, representing approximately sixfold growth in three and a half years.
The growth is even more significant when compared with the COVID-era trough of approximately Rs. 3,200 crore in March 2020.
The opportunity is not restricted to acquiring new customers. Brokers can introduce MTF to their existing customer base, thereby increasing revenue without having to acquire an entirely new customer.
For instance, Anand Rathi Share and Stock Brokers had only 7.24% of its active clients using MTF at FY26-end. This illustrates the potential for increasing product penetration within an already established customer franchise.
Why are brokers interested in MTF?
The primary attraction is the ability to generate interest income on a growing funding book. However, MTF is not a pure-margin business because brokers must arrange funding through their own capital, borrowings or other permitted funding channels.
Consequently, the profitability depends on the difference between the interest charged to customers and the effective cost of funds, after accounting for credit losses, operating costs and other expenses.
The economics can be understood as:
Customer interest income – Funding cost – Credit losses – Operating expenses = Net contribution.
The PhillipCapital report classifies MTF as a high-margin business, although it also identifies it as relatively capital-intensive.
An important example is Angel One. Its client funding book increased from approximately Rs. 14.9 billion in FY22 to Rs. 61.4 billion by June 2026. Correspondingly, interest income increased from approximately 15% of revenue in FY22 to approximately 32% in FY26.
This demonstrates how a traditionally brokerage-dependent business can gradually develop a significant interest-income component.
The opportunity is also visible at Groww, where its MTF book reached approximately Rs. 37.7 billion in June 2026.
Thus, MTF represents an important structural opportunity because brokers can monetise their existing customer base through financing rather than depending exclusively on transaction frequency.
4. Wealth Management: The Next Major Opportunity Beyond Retail Broking
Historically, brokers primarily focused on facilitating transactions. However, as financial savings increase and households gradually shift towards market-linked financial assets, the opportunity is expanding beyond trading into managing and distributing customers’ wealth.
Wealth management involves providing financial solutions to customers based on their investment objectives, risk appetite, financial position and long-term wealth creation requirements.
These services can include mutual funds, portfolio management services (PMS), alternative investment funds (AIFs), bonds, structured products, insurance and investment advisory.
The attractiveness of this segment comes from the growing pool of household financial savings in India.
India’s mutual fund industry AUM increased from approximately Rs. 22 lakh crore in FY20 to Rs. 88.3 lakh crore in August 2026. Monthly SIP inflows also increased from approximately Rs. 8,000 crore in FY20 to more than Rs. 32,000 crore in July 2026.
Why these numbers matter
A wealth management company does not need millions of retail customers to build a meaningful business.
Consider this illustrative scenario:
| Metric | Scenario |
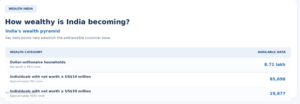
| Millionaire households in India | 8,71,000 |
| Customers captured by a wealth manager | 1% |
| Customers acquired | 8,710 |
| Assumed average assets managed per customer | ₹3 crore |
| Potential AUM | ₹26,130 crore |
At an illustrative annual fee yield of 1%, this AUM could generate approximately ₹261 crore in annual gross fee revenue.
This indicates that an increasing proportion of household savings is entering the formal financial investment ecosystem.
More importantly, direct equity and mutual funds account for only approximately 15–20% of household investible assets in India, compared with approximately 50–60% in the US and Canada, according to the report.
5. Mutual Fund Distribution: Building a Recurring Revenue Stream
Mutual fund distribution is another important adjacent business for broking platforms.
Brokers can earn distribution commissions, including trail commissions, depending on the product, distribution arrangement and applicable regulations.
The biggest advantage is that revenue is linked to the assets distributed and retained rather than solely to daily trading activity.
The opportunity is supported by the substantial growth of India’s mutual fund industry. MF AUM reached approximately Rs. 88.3 lakh crore in August 2026, compared with approximately Rs. 22 lakh crore in FY20.
Monthly SIP inflows also reached Rs. 32,297 crore in July 2026.
6. Asset Management, PMS and AIF: Moving Towards Higher-Value Financial Products
As the financial wealth of Indian households increases, the demand for sophisticated investment products is also expected to rise.
This creates an opportunity for brokers to expand into asset management, PMS and AIFs.
PMS involves managing an individual’s investment portfolio through a professionally managed strategy. AIFs provide access to alternative investment strategies and asset classes, generally catering to eligible investors under applicable regulations.
These businesses are strategically important because they allow financial intermediaries to move beyond simple transaction execution and participate in investment management.
Their economics are generally linked to management fees and, where applicable, performance fees.
Asset management can offer attractive margins once a sufficient AUM base has been established because additional assets can potentially be managed without proportionately increasing the entire operating infrastructure.
7. The Broader Financialisation Opportunity: Why India’s Addressable Market Is Still Expanding
The structural opportunity for the broking industry is supported by a significant difference between India’s existing financial market penetration and its potential penetration.
, India had more than 130 million unique stock-market investors in FY26, representing approximately 13.5% adult penetration.
This means that the majority of India’s adult population was still outside the direct stock-market investor base.
Additionally, India’s nominal GDP per capita increased from approximately US1,862inFY21toUS2,675 in FY26.
The report also highlights that middle-to-upper-income households, defined as households earning more than Rs. 8 lakh annually, are projected to increase from 34.38% of households in FY26 to 42.74% by FY31.
Approximately 27% of NSE investors were from states outside the top 10 in FY26, compared with 23.7% in FY21. Investor bases in several smaller states have increased five to nine times since FY21.
This indicates that the growth in capital-market participation is no longer restricted to metropolitan cities. For technology-led brokers, this provides a significant advantage because they can access customers across geographical regions without establishing a large physical branch network.
Therefore, the opportunity is supported by three interconnected developments:
First, an increasing number of individuals are entering the financial investment ecosystem.
Second, existing investors are accumulating larger financial assets as household incomes and savings increase.
The convergence of these three factors creates a structural growth opportunity for the industry.
Angel One From a Digital Broking Platform to an Integrated Financial Services Platform
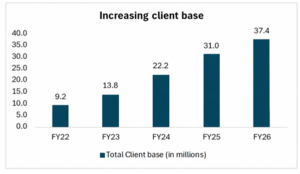
Angel One has built a sizeable retail franchise through its technology-led, digital-first business model, with its total client base increasing from 9.2 million in FY22 to 37.4 million in FY26. The company is now shifting its focus from customer acquisition towards deeper monetisation of its existing customer base by expanding beyond transaction-led broking into client funding, credit distribution, mutual funds, wealth management and asset management.
While FY26 profitability was impacted by moderation in trading activity following regulatory changes in the F&O segment, alongside investments in customer acquisition and the incubation of its Wealth and AMC businesses, operating metrics indicate an improvement in trading activity. During Q1FY27, cash ADTO increased 21% QoQ, while overall premium ADTO rose 39% QoQ, indicating a recovery in market participation. Angel One’s client base further expanded to 38.6 million by June 2026, with approximately 1.3 million gross client additions during Q1FY27. Its sizeable retail franchise and market presence provide a strong platform to capture incremental industry growth, with market shares of 20.2% in retail equity turnover, 22.2% in retail F&O, 17.4% in cash turnover and 52.3% in commodity turnover.
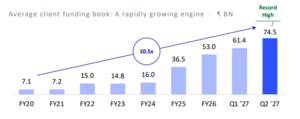
Its client funding business has emerged as an important source of interest income, with the average funding book increasing from ₹14.9 billion in FY22 to ₹61.4 billion by June 2026. Consequently, interest income’s contribution to revenue increased from approximately 15% in FY22 to approximately 32% in FY26. Alongside this, Angel One is leveraging its large customer base and integrated Super App to cross-sell financial products and expand into higher-value segments.
The wealth management business, operating under the Ionic Wealth brand, and its in-house Asset Management Company represent important components of this strategy. As of June 2026, Wealth Management AUM stood at ₹134.4 billion, while AMC AUM reached ₹6.2 billion. These initiatives are aimed at increasing customer lifetime value, improving revenue visibility and creating multiple monetisation opportunities across the customer lifecycle.
1. Client Acquisition and Broking Business
Angel One’s core broking franchise continues to provide the foundation for its broader financial services platform. Its total client base expanded from 9.2 million in FY22 to 37.4 million in FY26, reaching 38.6 million by June 2026. This expansion has been supported by its digital distribution platform, pan-India presence and ability to acquire customers across Tier-1, Tier-2 and Tier-3 markets.
The company has also maintained a significant market position across key trading segments, accounting for 20.2% of retail equity turnover, 22.2% of retail F&O turnover, 17.4% of cash turnover and 52.3% of commodity turnover as of June 2026.
During FY26, the broking business faced pressure from regulatory changes affecting derivatives trading activity. However, the recovery in trading activity during Q1FY27, reflected in a 21% QoQ increase in cash ADTO and a 39% QoQ increase in overall premium ADTO, indicates improving market participation. A recovery in trading volumes, combined with the company’s existing technology infrastructure, could support operating leverage and margin normalisation over the medium term.
Key operating metrics:
- Total client base: 37.4 million in FY26, increasing to 38.6 million by June 2026.
- Gross client additions: Approximately 1.3 million during Q1FY27.
- Retail equity turnover market share: 20.2%.
- Retail F&O market share: 22.2%.
- Cash turnover market share: 17.4%.
- Commodity turnover market share: 52.3%.
- Q1FY27 cash ADTO growth: 21% QoQ.
- Q1FY27 overall premium ADTO growth: 39% QoQ.
2. Client Funding and MTF Business
Angel One has significantly scaled this business, with its average client funding book increasing from ₹14.9 billion in FY22 to ₹74.5 billion by June 2026. The expansion in the funding book has translated into higher interest income, with its contribution to revenue increasing from approximately 15% in FY22 to approximately 32% in FY26.
Key operating metrics:
- Average client funding book in FY22: ₹14.9 billion.
- Average client funding book as of June 2026: ₹61.4 billion.
- Interest income contribution to revenue in FY22: Approximately 15%.
- Interest income contribution to revenue in FY26: Approximately 32%.
3. Wealth Management Business – Ionic Wealth
Angel One Wealth Limited, a wholly owned subsidiary of Angel One Limited, operates the company’s wealth management business under the Ionic Wealth brand. The platform represents Angel One’s strategic move towards premiumisation, targeting affluent, HNI and UHNI customers through a technology-enabled, omnichannel advisory model.
Technology and AI are also being integrated into the platform to improve service delivery and relationship manager productivity. Ionic’s AI agent supports real-time opportunity identification, portfolio drift detection and conversation memory, while approximately 80% AI integration in internal coding has been reported.
AUM and operating performance as of June 2026:
- Total Wealth AUM stood at ₹134.4 billion, increasing 33.3% QoQ.
- Active assets amounted to ₹127.8 billion.
- Custody assets amounted to ₹6.6 billion.
- Approximately 91% of total AUM was classified as ARR-generating, compared with approximately 86% in March 2026.
- Total clients crossed 2,400.
- UHNI families increased to 263 from 170 in the preceding quarter, representing approximately 55% growth.
Break-up of Wealth AUM:
| Wealth segment | AUM (₹ billion) | QoQ growth |
| UHNI | 87.3 | 29.8% |
| Wealth Tech | 32.3 | 34.8% |
| In-house Ionic Asset platform | 14.7 | 54.3% |
| Total | 134.4 | 33.3% |
4. Asset Management Business Angel One AMC
As of June 2026, AMC AUM stood at ₹6.2 billion, compared with ₹3.6 billion in March 2026, representing approximately 72% QoQ growth. The business remains in its second year of operation and has already established a distribution presence across more than 17,700 pincodes, with over 255,000 folios.
The company’s product portfolio currently includes:
- 3 index funds.
- 3 equity ETFs.
- 1 debt ETF.
- 2 commodity Fund of Funds.
- 2 commodity ETFs.
A key advantage for Angel One AMC is its ability to leverage the parent company’s existing digital distribution platform and third-party distribution partners. This can help reduce customer acquisition costs and accelerate product distribution without requiring a large physical branch network.
Share India Securities Business Overview and Growth Strategy
Share India Securities has evolved from a traditional brokerage into a technology-led financial services group, with businesses spanning broking and trading, algorithmic solutions, NBFC lending, merchant banking, insurance broking and wealth management. Its key strategic priority is to reduce dependence on proprietary trading and build a larger client-led franchise. In FY26, client-led turnover exceeded proprietary turnover for the first time, accounting for over 53% of total turnover, while management aims to increase this share to 70% over the next three to four years. The group is also expanding its MTF, PMS, debt distribution and digital wealth offerings to diversify earnings and improve revenue visibility.
1. Broking, Trading and Technology Platform
Broking and trading remain the core of Share India’s business. The company has developed capabilities in algorithmic and high-frequency trading through acquisitions such as uTrade Solutions, Algowire and Silverleaf Capital Services. These capabilities span strategy development, back-testing and low-latency execution, with the objective of serving both retail and institutional clients. In FY26, the Share Broking and Trading segment generated ₹1,387.8 crore of revenue, out of consolidated revenue of ₹1,470.3 crore. The company also reported that client-led turnover crossed 53% in Q4FY26, compared with a historically dominant proprietary-trading model. Management’s medium-term target is a 70:30 client-led to proprietary turnover mix.
2. Diversified Subsidiary Businesses – The ‘Navratna’ Verticals
Share India has established specialised subsidiaries across lending, merchant banking, technology and insurance to broaden its revenue base beyond broking. In FY26, these four non-broking businesses generated combined segment revenue of approximately ₹101 crore:
| Business | FY26 revenue | FY26 EBIT |
| NBFC – Share India Fincap | ₹55.5 crore | ₹8.6 crore |
| Merchant banking | ₹24.0 crore | ₹1.1 crore |
| Technology services | ₹12.8 crore | ₹3.2 crore |
| Insurance broking | ₹8.7 crore | ₹0.4 crore |
3. MTF and Funding-Led Monetisation
Margin Trading Facility is a key growth priority. The MTF book stood at approximately ₹470 crore in Q1FY27, against management’s target of ₹1,000 crore over the next two years. The company has raised capital through rights issues, warrants and listed non-convertible debentures to support exchange margins and client funding. However, funding cost remains an important variable: the ability to grow the MTF book profitably will depend on lending yields, borrowing costs, utilisation and credit quality.
4. Wealth Management and New Growth Initiatives
Share India is building its wealth offering through Share India Wealth Multiplier Solutions and Project Drone. PMS was launched in Q1FY27 and had crossed ₹150 crore of AUM; management is targeting ₹200–250 crore by the financial year-end, with an AIF launch planned for Q3FY27. Project Drone, incubated in 2025, is being developed as an integrated digital wealth platform combining broking, mutual funds, automated advisory, fixed income and credit products. It targets mass and emerging-affluent investors with investable assets of ₹10 lakh–₹10 crore, particularly in Tier-2 to Tier-4 markets. Share India Cred Capital is also developing a debt distribution platform, with a stated target of ₹500 crore in debt sales and origination.
Optical Fibre
The global optical fibre cable (OFC) industry has entered a multi-year structural supercycle expected to extend well beyond CY30. Worldwide OFC demand is projected to rise from 553 million fibre kilometres (mfkm) in CY25 to 760 mfkm by CY30, a 6.6% CAGR. North America and Europe are expected to see the fastest growth, with demand nearly doubling from 195 mfkm to 380 mfkm over the same period, or a 14.3% CAGR.
Supply Deficit and Structural Constraints
The industry faces an estimated global supply deficit of ~16.7% in CY26, likely widening into CY27. Western producers are operating at capacity ceilings, while new capacity is constrained by high capital intensity and the 18–24 months needed to commission glass preform facilities.
Upstream bottlenecks are amplifying the shortage:
- Chinese export restrictions have driven ex-China germanium prices up roughly tenfold.
- Global helium shortages have added further input-cost and supply pressure.
- U.S. delivery lead times have extended to 52 weeks.
Unlike earlier cyclical recoveries, this upcycle is more durable because hyperscale cloud providers are signing binding, multi-year supply contracts directly with manufacturers to secure long-term capacity.
Demand Catalysts
The supercycle is being driven by three major forces: AI data centres, nationwide broadband programs, and carrier network densification.
| Catalyst | Key trend | Implication for optical fibre |
| AI data centres | Global capacity expected to rise from 82 GW in CY25 to 220 GW by CY30, a 22% CAGR; AI workloads may reach 71% of total capacity | Fibre becomes the foundational physical layer for high-density compute |
| Broadband expansion | Global FTTx deployments projected at 171 mfkm by CY30 | Sustained demand from public programs such as U.S. BEAD and India’s BharatNet Phase III |
| Carrier densification | Telecom networks require higher-capacity, higher-density infrastructure | Increased adoption of high-fibre-count cables and DCI solutions |
Conventional copper cabling faces bandwidth and thermal limitations in ultra-high-density AI environments. GPU-intensive clusters can require up to 36 times more fibre than traditional builds, with cable configurations rising from the standard 288 fibres to 7,000–14,000 fibres per cable.
This has supported sharp pricing gains: standard fibre prices have reportedly increased from $3/km to $15/km, while specialized bend-insensitive fibre has climbed to $25–30/km. Large AI campuses are also driving rapid growth in Data Centre Interconnect (DCI) demand.
Public infrastructure spending adds another demand layer. The U.S. Broadband Equity, Access, and Deployment (BEAD) program is valued at $97 billion, while India’s BharatNet Phase III has a ₹1.39 lakh crore target covering 15 million rural homes. India’s data centre capacity is also expected to expand from ~1.5 GW to 7–10 GW by 2030, reinforcing domestic fibre demand.
India’s Strategic Position
With Western manufacturers capacity-constrained, Indian producers are emerging as important global suppliers. The domestic opportunity is led by two companies with different strategic profiles:
- Sterlite Technologies (STL): A pure-play optical connectivity specialist focused on hyperscale and data-centre demand.
- HFCL: A diversified telecom technology, fibre, and defence company with large-scale cable exposure.
Sterlite Technologies (STL): Pure-Play Hyperscaler Bet
STL operates an end-to-end “Glass-to-Gigabit” manufacturing model and is one of only six companies globally capable of producing its own glass preforms. This backward integration provides a meaningful competitive advantage during the global preform shortage.
STL has shifted away from commodity cable sales toward higher-margin products, including:
- Data-centre interconnects
- Pre-terminated connectivity solutions
- Low-latency Hollow-Core Fibre (HCF)
- High-density Multi-Core Fibre (MCF)
Contract Momentum
Major contract wins include:
- A US$1.2 billion multi-year long-term supply agreement for CY26–30.
- A US$1.11 billion hyperscaler product award for FY27–29.
- A US$288 million high-density cable agreement.
As a result, STL’s open order book reached a record ₹35,274 crore in Q2 FY27. Data centres contributed only 1% of FY26 revenue but rose to approximately 33% in H1 FY27; management targets 50–60% by FY29.
Growth and Financial Position
Under its Lakshya FY29 roadmap, STL aims to:
- Quadruple FY26 revenue to ₹20,000 crore.
- Expand EBITDA margins toward 30%.
- Increase capacity from 50 mfkm to 75 mfkm through a ₹3,000 crore capex program.
Following a ₹1,500 crore institutional placement in mid-2026, STL strengthened its balance sheet and achieved a net cash position of ₹703 crore. The company generated positive operating cash flow of ₹522 crore in FY26, offering strong operating leverage to the hyperscaler cycle—though it carries a premium valuation and customer-concentration risk.
HFCL: Diversified Telecom, Defence, and Fibre Scale
HFCL’s exposure spans optical fibre and cables, indigenous telecom equipment—including 5G fixed wireless access, Wi-Fi 7, and IP/MPLS routers—and defence electronics. Fibre remains its principal growth engine, representing about ₹19,000 crore of its ~₹29,000 crore order book in Q2 FY27. More than 70% of its optical cable production is exported, primarily to North America.
Competitive Advantages
HFCL has secured an anchor five-year global OFC supply contract worth approximately US$1.1 billion. It also holds a distinctive European advantage as the only Indian manufacturer exempt from EU anti-dumping duties on optical fibre cables.
To improve margins, HFCL is pursuing:
- Optical fibre capacity expansion to 4.31 crore fkm by mid-2028.
- Cable capacity expansion to 6.2 crore fkm by mid-2028.
- An in-house 600 MT preform facility targeted for late 2028.
- Expected fibre production cost reductions of 18–20% through backward integration.
Domestic and Defence Exposure
HFCL has also built a strong domestic digital-infrastructure franchise:
- ₹7,335 crore in BharatNet Phase III contracts.
- Indigenous router deployment.
- A ₹5,000 crore operations-and-maintenance book generating recurring revenue.
- A defence order book of approximately ₹2,300 crore, focused on electronic fuzes and aerostructures.
HFCL trades at a discount to STL but carries greater working-capital intensity. Its FY26 operating cash flow was negative at -₹378 crore, with capital expenditure funded through debt and accruals.
If you need guidance on how to start your stock market journey, how much capital is enough to begin with, how to do smart investing, or how to take informed stock market decisions, you can join Strategic Alpha’s ‘The Conviction Club’. This is a membership program, especially curated to help investors become aware and knowledgeable about stock market trends, news, and technical aspects, so that they can become their own experts.
Our YouTube channel, weekly webinars, and digital resources available on the website can help you learn the basics of the stock market. For regular updates on trends, one-to-one sessions with experts, and detailed learning modules, you can join the Conviction Club, which is the online community of like-minded investors sharing knowledge and thoughts to grow together.
Subscribe to the Strategic Alpha Newsletter now to get the latest updates about weekly webinars.
Join Me On My Telegram Channel Where I Share Much More Value Adding Knowledge Of Investing/ Trading: Click Here
Also, Don’t Forget To Follow Us On Our Social Media Accounts:
Facebook: https://www.facebook.com/strategicalpha/
Instagram: https://www.instagram.com/strategicalpha/
Twitter: https://twitter.com/suyog_dhavan
YouTube: https://bit.ly/2IIqztO
Disclaimer: Strategic Alpha and Suyog Dhavan are not SEBI-registered investment advisor. The content provided is purely for educational purposes and should not be construed as financial or investment advice. Viewers are encouraged to conduct their own research or consult with a SEBI-registered professional before making any investment decisions.