

Financial ratios are computations performed on items on income statements, balance sheets, and cash flow statements to determine a company’s relative strength. Ratios assess a company’s operational efficiency, liquidity, stability, and profitability, providing more useful information to investors than raw financial data. The highly popular, and arguably important technique of ratio analysis can help investors and analysts acquire profitable advantages in the stock market. Let us discuss a few important financial ratios that would aid you in the process of making the right investments.
Return on Equity
Introduction
Return on equity, or ROE, is a metric for assessing a company’s or an enterprise’s performance over time. To calculate the return on investment, take the company’s net income and divide it by the shareholders’ equity.
Return on equity is a percentage figure that can be used to assess a company’s performance. It can also reveal how a company manages its equity and assets to generate profits. As a result, potential investors frequently analyse an enterprise’s ROE before investing.
Formula
Return on equity = Net income / Equity of the shareholders.
Interpretation
A high return on investment (ROI) indicates that a company’s management team is more effective at using investment capital to expand their firm (and is more likely to provide better returns to investors). A low ROE, on the other hand, may suggest that a company is mismanaged and is reinvesting earnings in ineffective assets.
A high ROE could signal that the company is making good use of its equity capital, but it could also indicate that it has taken on a lot of debt. As a result, it’s critical to avoid viewing this financial ratio in isolation. A high debt-to-equity ratio (also known as a high debt-to-equity ratio) can make ROE appear artificially higher than competitors with lower debt.
Ideal ROE
A specific range of ROE cannot be declared a good return on equity. An ROE of more than 25% is ideal in some businesses, while a value of more than 15% may be deemed extraordinary in others.
Lower ROE, on the other hand, does not automatically signify impending company disaster. In some circumstances, the ROE may fall in a given year for a variety of reasons.
For example, the corporation may have recently purchased some critical machinery after getting new funding. In such a case, the firm’s return on equity would decrease, but only temporarily.
What determines whether a ROE is excellent or negative is what is considered normal among a stock’s peers. Utilities, for example, have a lot of assets and debt on their balance sheet compared to a little amount of net income. In the utilities business, a typical return on investment (ROI) could be as low as 10%. A technological or retail company with smaller balance sheet accounts compared to net income may have a normal ROE of 18% or higher.
A decent rule of thumb is to aim for a return on equity (ROE) that is equal to or slightly higher than the industry average. Assume a business, Techno Ltd, has maintained a consistent ROE of 18 percent for the last four years, compared to the 15 percent average of its peers. An investor might conclude that Techno Ltd’s management is above average at generating profits from the company’s assets.
Limitations of ROE
A high return on equity (ROE) isn’t always a good thing. An excessive ROE might indicate a variety of problems, including uneven profitability or high debt. Furthermore, a negative ROE resulting from a net loss or negative shareholders’ equity cannot be utilised to evaluate a company or to compare it to companies with a positive ROE.
High ROE Stocks in India
| Company | 2020 | 2021 | Avg 5 year |
| Hindustan Unilever Ltd | 84.15% | 28.63% | 67.14% |
| Nestle India Ltd. | 70.39% | 105.76% | 58.17% |
| Colgate-Palmolive (India) Ltd. | 53.75% | 75% | 55.98% |
| Procter & Gamble Hygiene and Health Care Ltd. | 42.74% | 71.64% | 52.26% |
Return on Capital Employed
Introduction
The return on capital employed (ROCE) is a financial metric that may be used to assess a company’s profitability and capital efficiency. In other words, the ROCE ratio can help determine how well a company earns profits from its capital when it is put to work. Financial managers, stakeholders, and potential investors may use the ROCE ratio as one of many profitability ratios when evaluating a company for investment.
Formula
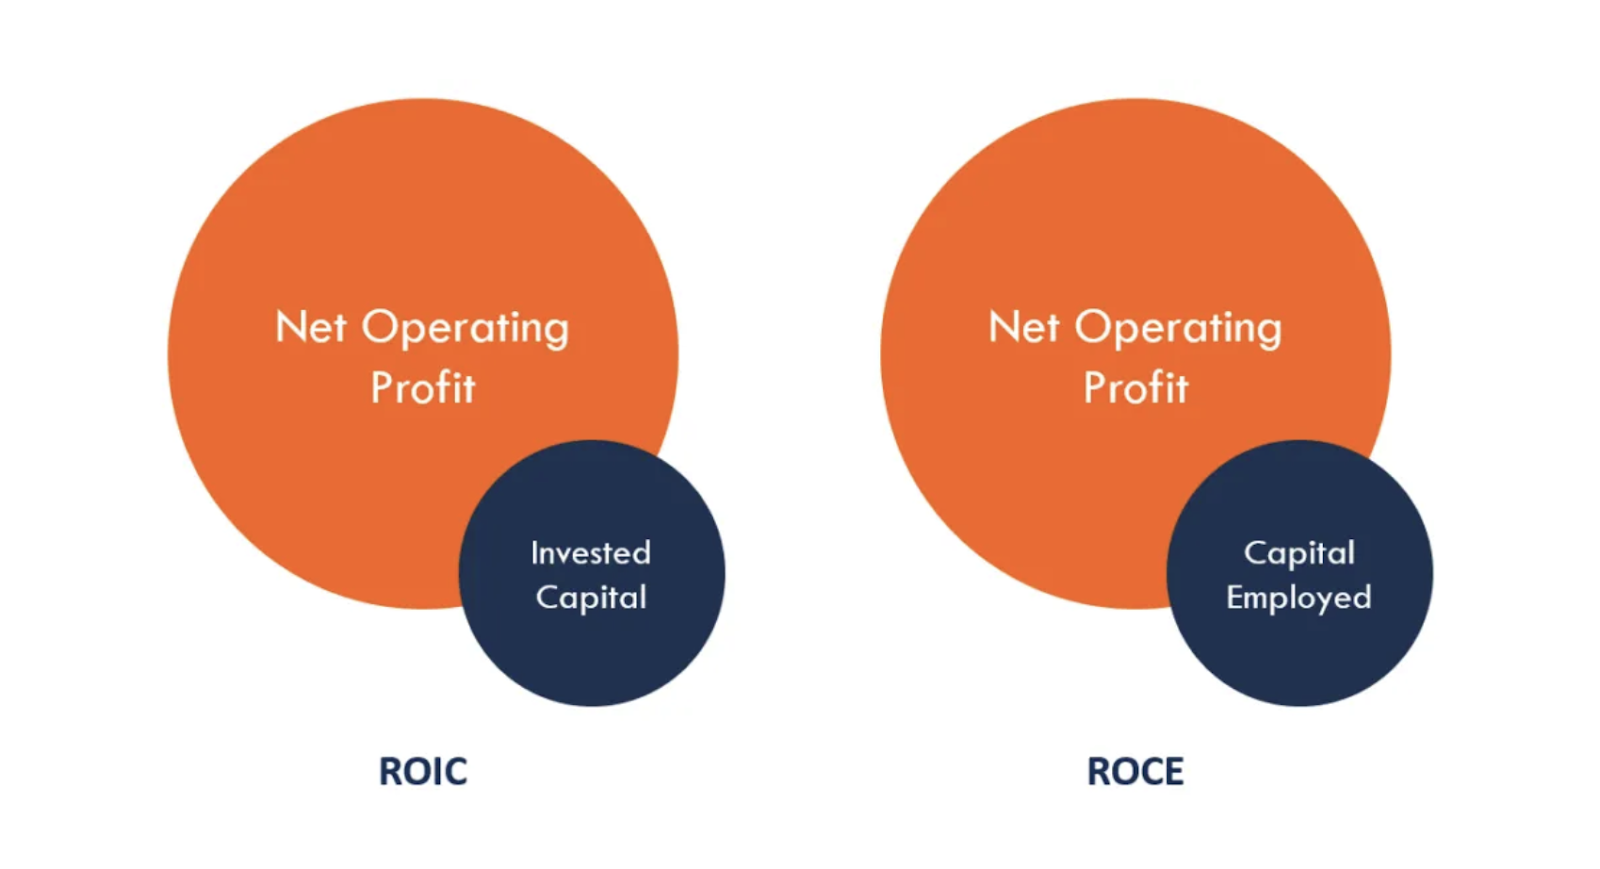
ROCE= EBIT/Capital Employed
EBIT = Earning before he interest and tax
Capital Employed = The Total assets – The current liabilities
ROCE is a metric for evaluating profitability and comparing capital profitability levels across companies. Earnings before interest and tax, as well as capital employed, are used to determine return on capital employed.
EBIT stands for earnings before interest and taxes, and it shows how much money a company makes from its operations alone. Revenue is subtracted from cost of goods sold and operational expenses to arrive at EBIT.
Capital Employed: It’s a lot like the invested capital used in the ROIC calculation. Deducting current commitments from total assets yields shareholders’ equity plus long-term loans, which is the capital used. Some analysts and investors may prefer to calculate ROCE using average capital used, which is the average of opening and closing capital used for the time period under consideration, rather than capital used at a random point in time.
source: corporatefinanceinstitute
Interpretation
When evaluating the performance of companies in capital-intensive industries like utilities and telecoms, ROCE can be extremely valuable. This is because, unlike other fundamentals like return on equity (ROE), ROCE counts both debt and equity. This can help organisations with large debt neutralise financial performance analyses.
Finally, the ROCE calculation tells you how much profit a company makes per rupee of invested capital. The higher a company’s profit per rupee, the better. As a result, a larger ROCE suggests more profitability when comparing companies.
Ideal ROCE
While there is no industry standard, a higher return on capital indicates a more efficient company, at least in terms of capital employed. Because cash is included in total assets, a bigger value may suggest a company with a lot of cash on hand. As a result, big sums of money may occasionally skew this figure.
Limitations of ROCE
Even though ROCE can be a useful indicator of profitability, there are various reasons why investors would not want to use it to make investment decisions.
To begin with, the values used to compute ROCE are taken from the balance sheet, which is a collection of historical data. As a result, it does not always present an accurate picture of the future. Second, because this strategy generally focuses on short-term accomplishments, it may not be a strong indicator of a company’s longer-term performance. Finally, ROCE cannot be changed to account for various risk variables associated with various investments made by a corporation.
ROCE of Stocks in India
| Company | ROCE | Interpretation |
| ITC Ltd | 28.5% | This means for every hundred rupee of capital employed, ITC Ltd makes Rs 28.50. |
| Raymond Ltd | -3.76% | This means the company is losing 3.7 rupees per hundred rupees of capital employed. |
| Tata Motors Ltd | 1.51% | This means for every hundred rupee of capital employed, Tata Motors Ltd makes Rs 1.51. |
| Future Retail Ltd. | -13.7% | The company is losing Rs 13.7 per hundred rupees of capital employed. |
Trailing 12 Months (TTM) Earning Per Share (EPS)
Introduction
TTM EPS stands for the company’s EPS over the previous 12 months. This differs from the company’s full-year EPS reported in the prior audited financial year.
TTM is a method of analysing a public company’s or a security’s performance over the previous 12 months. Investors and analysts can use a trailing twelve months of a company’s price-to-earnings ratio, earnings, or revenue to analyse data that isn’t bound to the calendar year or the fiscal year.
In its most basic definition, earning per share (EPS) refers to the amount earned by a shareholder on his one share. EPS is a financial statistic used to determine a company’s earning capability or profitability. Increased EPS indicates greater shareholder interest in the company because it indicates higher profitability. When EBIT rises, EPS rises as well. EBIT stands for Earnings Before Interest and Taxes. As a company’s EBIT (profits before interest and taxes) climbs the success ladder, the opportunities for contributing to shareholder earnings expand.
TTM stands for trailing twelve months, which refers to the performance of a matrix or line item over the previous 12 months.
As a result, EPS (TTM) refers to the company’s total earnings or profits for the previous 12 months.
For example, if you wish to look at EPS TTM in May 2020, it will take into account EPS from May 2019 to May 2020.
Calculation
The majority of Indian businesses operate on a calendar year that runs from April 1 to March 31. Using Company A as an example, the following EPS were reported for various periods:
| Period | EPS (in Rs.) |
| Quarter ended 31st March 2021 | 10 |
| Year ended 31st March 2021 | 38 |
| Quarter ended 30th June 2021 | 11 |
| Quarter ended 30th September 2021 | 12 |
| Quarter ended 31st December 2021 | 12 |
For FY21, the company reported full year EPS of Rs. 38.
As on 31st December 2021, its TTM EPS is the sum of EPS of the last 4 quarters beginning with the March 2021 quarter.
Thus, TTM EPS for company A = EPS for March 2021 quarter + EPS for June 2021 quarter + EPS for September 2021 quarter + EPS for December 2021 quarter
= 10 + 11 + 12 + 12
= Rs. 45
Interpretation
Investors seeking growth look out for companies that are expanding their earnings quarter after quarter, and especially year after year. To see if the company is accomplishing that, they might look at trailing EPS or yearly EPS.
Growth investors want a rise in quarterly earnings over the same quarter the previous year. They also want the fiscal year’s earnings to be higher than the previous year’s. Furthermore, if the fiscal year results have not yet been released, the investor might compare the trailing EPS to the prior fiscal year. Ideally, the trailing EPS will be higher.
Some growth investors look at profit estimates as well, and they want to see anticipated earnings for future quarters increase as well.
A decrease in percentage growth from quarter to quarter or year to year indicates that the company is still growing, but not at the same rate as before. This may signal to some growth investors that it is time to exit long positions.
There is no growth and the company is contracting if quarterly or annual EPS, or trailing EPS, is declining relative to past data. This is hardly the kind of action that growth investors seek.
Limitations of TTM EPS
TTM stands for twelve trailing months in abbreviated form. TTM EPS, on the other hand, is a 12-month earnings per share valuation. For this calculation, the most recent four earnings announcements are used. The data is calculated on a rolling basis because it is a trailing earnings ratio. With each new earnings announcement, this formula will alter.
One reason against using TTM EPS is that it uses previously collected data. As a result, there is a chance that future earnings will not follow the existing trend, affecting the investor’s gains.
Price/Earnings Ratio
Introduction
The PE (price to earnings) ratio is a popular stock picking metric. The ratio is used to determine a company’s value based on the current stock price per share for each rupee of future earnings. Based on how the company’s share prices are proportional to its profits per share, the P/E ratio helps to assess the company’s current worth and expected growth.
Formula
P/E Ratio = (Current Market Price of a Share / Earnings per Share)
Price to Earnings Ratio is one of the most widely-used metrics by analysts and investors across the world. It signifies the amount of money an investor is willing to invest in a single share of a company for Re. 1 of its earnings.
If a company’s P/E Ratio is 20, for example, investors are willing to pay Rs. 20 in stock for Re. 1 in current earnings.
Interpretation
When transacting in the stock market, investors who follow the “value investing” concepts analyse the intrinsic worth of a company’s underlying assets rather than its current market price.
One of the most common indicators used in this regard is the P/E ratio, which helps assess whether a company is overvalued or undervalued.
A high P/E ratio indicates that a firm’s share prices are considerably greater than its earnings, and hence the company may be overpriced. Value investors avoid such overpriced equities because they suggest strong speculation, which exposes the company to systematic risks caused by inefficient fund management. This method assists investors to avoid falling into a value trap.
If a stock’s P/E is lower than average, it means that the stock’s price is undervalued in relation to the company’s earnings. This scenario is viewed as a positive indicator for investments by value investors, who can buy these stocks at a lower price than their inherent value and sell them at a higher price later when stock prices rise.
An investor should examine the PE Ratio of the Industry in the same way that they evaluate the PE Ratio of a stock.
PE Ratio by Industry = Current Market Price of the Sectoral Index / Weighted Average Earnings per Share of the Index’s Stocks
Once the industry’s PE ratio has been computed, it should be compared to the PE ratios of individual stocks in the same industry. This might be a useful tool for determining the premium or discount of a certain stock.
While the PE Ratio can be used to analyse a variety of businesses, there are some areas where the PE has limited use and other valuation methodologies are preferable.
- Banking – P/B Ratio is preferred over the P/E Ratio
- Manufacturing/Commodity and Asset Heavy Businesses – EV/EBITDA is used in combination with the P/E Ratio
- Holding Companies – Net Asset Value basis
Ideal P/E ratio
There is no specific ideal PE ratio. To determine whether the PE ratio is right, the investors can undergo the following methods.
Comparing the stock’s PE ratio to the industry in which it operates: The average of the PE ratios of all companies in a certain industry that are listed on the stock exchange is known as the industry PE ratio. If a stock’s PE ratio is higher than the industry’s, it is considered overvalued, and vice versa.
Comparing the current PE ratio to the stock’s historical PE ratio: if the current PE ratio is lower than the stock’s average PE ratio over the last 10 years, it is considered cheap, and vice versa.
When the PE ratio is compared to the earnings (EPS) growth rate (PEG ratio),
Limitations
Although P/E ratio research can provide a reasonable estimate of whether a company’s stocks are overvalued or undervalued, it is not without flaws.
The P/E ratio does not take into account a firm’s EPS growth rate, which is why investors use the PEG ratio, or Price to Earnings to Growth ratio, to determine which company has the most potential.
Another reason why the P/E ratio cannot be utilised simply to make an investing choice is that a company’s earnings are reported every quarter, yet stock prices change on a daily basis. As a result, the P/E ratio may not agree with a company’s performance for a long period, leaving room for investors to make mistakes.
As a result, investors should never base their decision to invest in a company just on its P/E ratio. They should also take into account a variety of other factors that influence the underlying value of equities. These factors include whether the company’s respective industry is experiencing an economic crisis or a cyclical boom, the company’s past performance, scale (large-cap, mid-cap, or small-cap), EPS growth prospects, which industry the company belongs to, average P/E in the stock market, how companies of similar scale are performing, current and future demand for the particular industry, and so on.
Trailing PE ratio
Introduction
The trailing P/E is calculated by dividing a company’s recent stock price by its total EPS earnings over the previous year. It is one of the most trustworthy and popular PE metrics because it is based on actual profit data. Because future earnings predictions may be incorrect, prudent investors use the trailing PE to make most of their financial decisions. Investors should keep in mind, however, that a company’s past success does not guarantee its future behaviour.
Formula
Trailing PE Ratio = Current Per Share Price of Stock/ EPS from previous year
Interpretation
Instead of future estimates, trailing P/E ratios are calculated using a stock’s earnings per share over the last 12 months.
Many investors like this approach of valuation since it is more objective, as it is based on actual data rather than forecasted data.
Experts expect earnings to increase if the forward PE ratio is lower than the trailing PE ratio, and analysts expect earnings to drop if the future PE ratio is greater than the trailing PE ratio.
Some investors prefer to solely look at the trailing PE ratio. However, the trailing PE ratio has its own drawbacks as well. For one thing, historical performance does not always imply future success, and the EPS number remains constant while the stock price swings daily. If the company has significant news events, such as an investor day or an announced merger, the trailing PE ratio will not reflect these changes.
Limitations
The trailing P/E ratio does not represent current business conditions. While trailing P/E ratios take into account a company’s stock’s most recent price change, the earnings considered are still the most recent quarterly earnings. So, while the stock price fluctuates every few hours, the trailing P/E ratio remains more or less constant as the EPS is dated. As a result, some investors prefer the forward P/E ratio to the trailing P/E ratio.
Using PE Ratios
A very high PE ratio does not always indicate that expectations have become too high. For example, Amazon’s trailing PE ratio increased from around 70 at the start of 2011 to 130 by the middle of the year. However, during the same time period, the stock soared 46 percent and continued to rise for the next five years. It can pay off if a company can achieve the expectations implied by a high PE ratio.
The PE ratio is a good place to start filtering out companies. It isn’t the start or the finish of an investor’s research of a firm. It has the potential to exaggerate both the good and the drawbacks. It also ignores important details like the dividend yield, a company’s debt level, management changes, and a slew of other difficulties.
While it is feasible to build an investing strategy only on the basis of the PE ratio, it is arguably better viewed as a first step toward investing in a certain firm.
Forward PE Ratio
Introduction
The forward price-to-earnings (forward P/E) ratio is a variation of the price-to-earnings (P/E) ratio that employs expected earnings to calculate the P/E.
Formula
Forward PE Ratio = Market Price per Share / Projected Earnings per Share
Interpretation
Because the stock market is forward-looking (rather than backward-looking), it focuses more on what is projected to happen in the future rather than what has already occurred.
As a result, forward valuation multiples are often given more weight than historical multiples.
In April 2021, Tesla had an abnormally high P/E of 1101.16. However, due to an increase in earnings, it is anticipated to reduce to 244.7 in 2022. The fact that the P/E has dropped greatly indicates that analysts expect the Tesla stock to do well in the future as a result of popular innovation.
Limitations
Because forward P/E is based on projected future earnings, it is susceptible to errors and/or analyst prejudice. There are other issues with the forward P/E as well. When the next quarter’s profits are revealed, companies may understate earnings in order to beat the consensus estimate P/E.
Other corporations may exaggerate their forecast and then lower it in their next earnings report. Furthermore, outsider analysts may make forecasts that differ from those provided by the corporation, causing confusion.
Price to Book Ratio
Introduction
The P/B ratio is used to compare the market value of a stock to its book value. It’s computed by dividing the stock’s current closing price by its book value for the most recent quarter. P/B stands for price per share divided by book value per share.
Most conservative investors assess the price-to-book ratio (P/B ratio) because it provides a more tangible indicator of a company’s value than earnings.
Formula
P/B ratio = Market capitalisation / Book value of assets
Alternatively, investors can derive this ratio as expressed below –
P/B ratio = Market price per share / Book value of assets per share
To begin, investors must calculate the market capitalization of a firm by multiplying the current market price of its stocks by the total number of outstanding shares.
Market capitalisation equals the stock’s market value multiplied by the number of outstanding shares.
Second, investors must figure out how much an organisation’s assets are worth. They must add the book values of all assets in a company’s balance sheet and subtract the total value of all loans and liabilities to do so.
Total assets – total liabilities Equals book value of assets
In a roundabout way, this value symbolises an organisation’s equity value.
Interpretation
The Price-to-Book ratio is used by value investors to identify undervalued corporate stocks. It depicts the link between what the market thinks a company’s equity is worth and the actual book value of that stock. As a result, it is a significant agent for value investment.
The P/B ratio is frequently used in conjunction with return on equity (ROE), a dependable growth metric, to give a crucial reality check for investors seeking growth at a reasonable price. Large differences between the P/B ratio and ROE are frequently a red flag for businesses. Low ROE and high P/B ratios are common characteristics of overvalued growth stocks. If a company’s ROE is increasing, so should its P/B ratio.
Ideal P/B ratio
The PB ratio, like most financial measures, varies by industry. The ideal price to book value ratio, however, is less than or equal to one. This indicates a company that is undervalued. However, a price-to-book value ratio of up to three is allowed. Companies with a high price to book value are overvalued and do not meet the requirements for value investment.
Limitations
P/B ratios may not be comparable when organisations’ accounting standards differ, especially when companies are from different nations. Furthermore, for service and information technology companies with few tangible assets on their balance sheets, P/B ratios may be less effective. Finally, a protracted string of negative earnings might cause the book value to go below zero, rendering the P/B ratio meaningless for relative pricing.
Other issues with using the P/B ratio arise from the fact that a variety of factors, such as recent acquisitions, write-offs, or share buybacks, can skew the book value figure in the equation. Investors should use numerous valuation indicators in addition to the P/B ratio when looking for inexpensive stocks.
P/B Ratio & ROE of Indian Stocks
| Company | P/B Ratio | ROE |
| MRF Ltd | 2.18 | 4.88 % |
| Tata Consultancy Services Ltd | 14.0 | 43.6 % |
| Aditya Birla Fashion & Retail Ltd | 9.46 | -33.8% |
In an ideal scenario, ROE would be equal to price to book value. For investors, an abnormal departure can be a possible red flag. Companies having an excessively high price-to-book ratio but a low return on investment (ROI) should be avoided at all costs.
Conclusion
Companies use ratios to compare themselves. They assess stocks within a certain industry. They also compare a company’s current performance to its previous results.
In general, ratios are employed in conjunction with other ratios rather than on their own. Understanding what ratios mean and where to locate all of the data you’ll need to calculate them will offer you more confidence in your financial decisions and even save you money.


Dear Suyog Sir
Very well explained and very educational. I am learning from you a lot by reading your post. Keep it up
Thanks
Very well explained. Thank you for the efforts.