
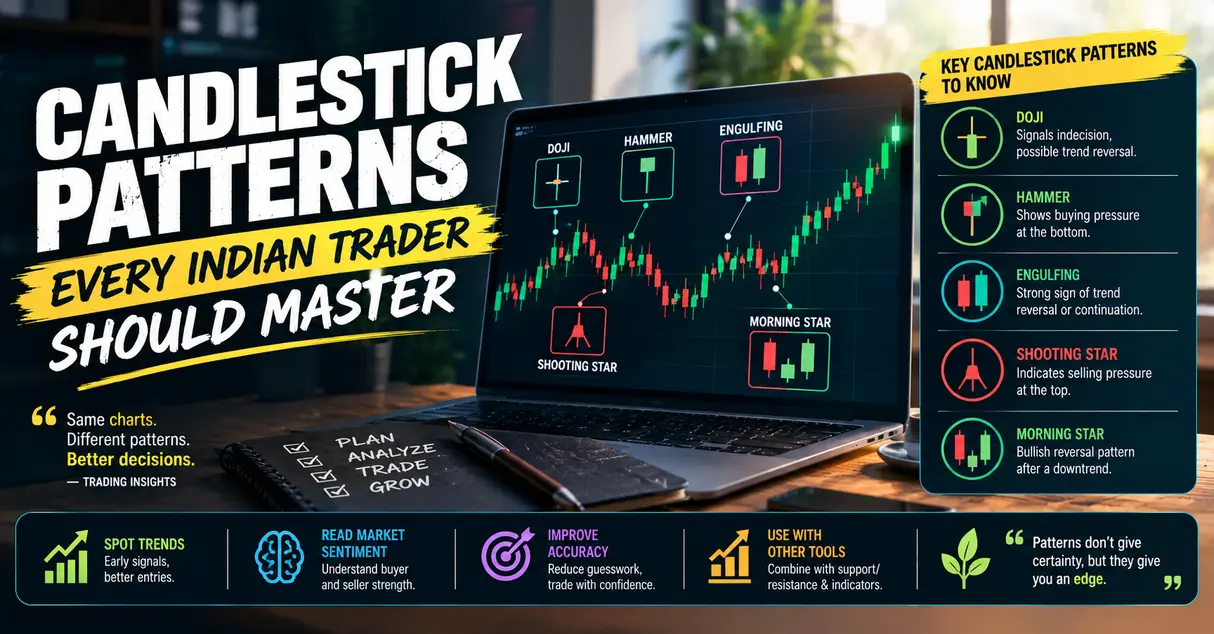
With the increasing number of retail investors, multiple trading apps, and seamless usage compared to the non-digital era of trading, the stock market has become a popular choice for passive income or a second income option. Although for many, the stock market is their primary source of earnings, these are mostly traders who operate daily by analyzing charts and patterns to decide entry and exit points.
If you are a trader and want to make sure that most of your trading decisions are reasonably accurate, then you must have a thorough knowledge of how to operate on candlestick patterns in the stock market. By identifying these candlestick patterns and using them in your trading strategy, you can mitigate risk, earn profits, and safeguard your capital.
Understanding Candlestick Patterns
Unlike long-term investments, where you can buy stocks and forget to monitor your portfolio, trading requires daily monitoring and analysis. In most investment cases, you won’t lose your capital, as there will be a point when the stocks regain their bullish momentum, but trading is not like that. You might lose all your capital within a few hours if you are not cautious and if your trade is based on the anticipation that equity prices will rise; proper knowledge of candlestick patterns is a must.
Candlestick patterns are the graphical representation of the price movement of a stock over a specific period of time. A candlestick pattern displays the open, High, Low, and Close prices of equities. Understanding these patterns helps in timing the market, as these patterns reveal market sentiment.
How Candlestick Patterns Help Traders
The Indian stock market is highly driven by emotions and market sentiments; thus, for traders, it becomes essential to identify price movements for profitable trades.
Candlestick patterns help traders:
- Identify price momentum
- Detect reversals
- Spot emerging trends
Most Important Candlestick Patterns
For a better understanding, let’s discuss some of the important candlestick patterns.
Doji
The Doji pattern shows confusion in the market as traders are unable to predict whether the stock will be bullish or bearish. During a Doji, the opening and closing prices of a stock are almost the same. To make a trading decision, investors wait for the market to show another candle after a Doji, as a Doji alone doesn’t confirm the market trend.
Hammer
Just as the name suggests, the Hammer candlestick pattern has a small body at the top and a long shadow below it. Hammer usually appears after a downtrend, indicating that now the buyers are getting stronger and the market might witness a reversal.
Shooting Star
A Shooting Star is exactly opposite of the Hammer. This candle pattern has a small body at the bottom and a long shadow above it. It appears when there is an uptrend, and the bulls are controlling the market. When it appears, it usually indicates that sellers might take control soon. You should be cautious when the Shooting Star appears and wait for the next candle. If the next candle is bearish, then you may witness a strong downward move.
Bullish Engulfing
Bullish Engulfing is one of the strongest reversal signals for buyers. This pattern is identified when a small red (bearish candle) gets covered by a big green (bullish candle). It indicates that the buyers are getting stronger, and bullish momentum is about to happen.
Bearish Engulfing
The Bearish Engulfing pattern indicates that there is selling pressure in the market, and we may witness a downtrend soon. When a small green candle is followed by a big red candle, it indicates that the market will witness a downtrend now.
Morning Star
Morning Star is a pattern of three candles, starting with a strong red candle, then a candle of indecision, and a strong green candle. It is considered a powerful symbol that the stock price is going to rise now.
Evening Star
This candlestick pattern is identified when there are three candles, one strong green candle, one candle of hesitation, and one strong red candle. This pattern indicates that bulls are losing their strength and bears are ready to capitalize.
Harami
The Harami candlestick pattern is a two-candle pattern that indicates a reversal from the current trend. In Bullish Harami, a large red candle is followed by a small green candle, which resembles the shape of a pregnant woman. Bearish Harami is also the same in appearance, but in this one, the red and green candles alternate with each other.
Common Mistakes To Avoid While Using Patterns
Blindly Following Patterns
One of the biggest mistakes traders make while following candlestick patterns is that they blindly follow every indication. Always wait some time for the next candle, and analyze where the market is heading. The pattern should make some sense, and that is why it is important to verify the pattern by checking the news and market sentiments.
Ignoring Overall Trend
If the overall market trend is bullish and in between, you get to see candlestick patterns that indicate a reversal, but it is not necessary to start short selling. Try to follow the trend that is strong at the moment and wait for the patterns that are in alignment with the overall trend.
Not Waiting For Confirmation
Always wait for the next candle after you see any candlestick pattern. It will help you identify the direction of the trade and minimize risks.
Not Using a Stop Loss
If you are not using a stop loss, you are increasing your chances of getting a huge loss from just a single wrong decision. Setting a stop loss is necessary if you want to sustain in the market for the long term. You might earn hefty profits in the market with several trades, but one wrong trade decision is enough to drain a significant amount of your capital.
Way Forward
Candlestick patterns show probability, not certainty. It is essential to follow these patterns for less risky trades, but it is also necessary to understand that nothing is sure in the stock market, and even highly researched and time-tested strategies may fail. It is important to trade cautiously and to avoid using all your funds on a single trade.
If you are new to the stock market or if you are enthusiastic about learning the stock market, you can join Strategic Alpha’s ‘Conviction Club’. This is a membership program for those who want to make practical and rational investment decisions in the stock market and want to avoid operating on emotions.
For more details on ‘The Conviction Club’, visit our website.
FAQs
1. What are candlestick patterns?
Candlestick patterns are the graphical representation of the price movement of a stock over a specific period of time. A candlestick pattern displays the open, High, Low, and close prices of equities. Understanding these patterns helps in timing the market, as these patterns reveal market sentiment.
2. Why are candlestick patterns important?
Candlestick patterns are important as they help traders:
- Identify price momentum
- Detect reversals
- Spot emerging trends
3. Which candlestick patterns should beginners learn first?
Beginners should start with commonly used candlestick patterns like:
- Doji
- Hammer
- Shooting Star
- Bullish Engulfing
- Bearish Engulfing
4. Are candlestick patterns reliable on their own?
No, candlestick patterns are reliable only when used in combination with stop loss, support & resistance, and trend analysis.
5. Do candlestick patterns work in Indian markets?
Yes, they give a notion about market sentiments and buyers’ psychology, and work well in the Indian stock market with proper risk management.
If you need guidance on how to start your stock market journey, how much capital is enough to begin with, how to do smart investing, or how to take informed stock market decisions, you can join Strategic Alpha’s ‘The Conviction Club’. This is a membership program, especially curated to help investors become aware and knowledgeable about stock market trends, news, and technical aspects, so that they can become their own experts.
Our YouTube channel, weekly webinars, and digital resources available on the website can help you learn the basics of the stock market. For regular updates on trends, one-to-one sessions with experts, and detailed learning modules, you can join the Conviction Club, which is the online community of like-minded investors sharing knowledge and thoughts to grow together.
Subscribe to the Strategic Alpha Newsletter now to get the latest updates about weekly webinars.
Join Me On My Telegram Channel Where I Share Much More Value Adding Knowledge Of Investing/ Trading: Click Here
Also, Don’t Forget To Follow Us On Our Social Media Accounts:
Facebook: https://www.facebook.com/strategicalpha/
Instagram: https://www.instagram.com/strategicalpha/
Twitter: https://twitter.com/suyog_dhavan
YouTube: https://bit.ly/2IIqztO
Disclaimer: Strategic Alpha and Suyog Dhavan are not SEBI-registered investment advisor. The content provided is purely for educational purposes and should not be construed as financial or investment advice. Viewers are encouraged to conduct their own research or consult with a SEBI-registered professional before making any investment decisions.