Stock market is a much bigger concept than you might think as a beginner or mid-level investor. There is a concept called ‘sector rotation strategy’ in the stock market, which helps you understand how different sectors in the stock market perform during different economic cycles. As an expert investor with over a decade of experience, Suyog Dhavan explains the concept in detail in the attached video. Further in this blog, we will discuss the important pointers mentioned in this video by Strategic Alpha:
Expectations as an Investor
Before proceeding further on this topic, you should first understand what should be your ideal expectations as an investor:
- During falling markets, fall lesser than markets
- During rising markets, rise more than markets
If you are able to do that, it is known as Alpha generation. If you are able to do that for longer periods of time, you will never be worried about the market correction.
Everything is cyclical in this world
Understanding this is very important. Just like you are sometimes happy then sad, then happy again, things are cyclical in the stock market as well. There are even greed (bull market) and fear (bear market) cycles in the market. Even in businesses, there is cyclicity. Businesses go through up cycles and down cycles. Even FMCG is cyclical, but it’s just that the level of cyclicity is low. There are some businesses with high levels of cyclicity like metals and there are some businesses with low levels of cyclicity like FMCG.
Business Cycles:
Businesses reach the peak levels, then recession, then go through depression, and then expansion happens. This cycle is repeated again and again. This is also very similar to the ‘economic cycle.’
Interest Rate Cycles:
If there is a weak economy, the central bank lowers the rate. As a result, the money becomes cheap and when it happens, more business investments happen. It encourages more consumer spending and weak exchange rates, due to which the economy improves. Now as the economy improves, there are competitive exports and expensive imports, which results in a booming economy. During a booming economy, there is higher employment, higher inflation, and increased borrowing. Now, all these factors again make the economy weak. That’s how an interest rate cycle or economic cycle works.
Market Cycles – Key for Asymmetric Bets
Market cycles are ahead of economic cycles. When there is recession, the market will bottom out. It actually bottoms out much before the recession and it tops out much before the boom. So, the stock market is a leading indicator as it moves ahead of the real economy. Howard Marks has written a book on ‘Mastering the Market Cycle,’ which you can read or you can refer to this blog on Strategic Alpha: Second Level Thinking, in which the learnings of this book are simplified.
The market is a probability game. You cannot always win, but what is important is to ensure that when you lose, you should lose less and when you win, you should win big. That’s exactly what your expectation should be and that is the opportunity you need to find. Market cycles create such an opportunity for an investor to create asymmetric bets in their portfolio.
Understanding Sector Rotation in the Stock Market
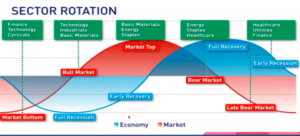
Based on the cycles, sectors also start rotating. In the above image, the red line is the market line and the blue line is the economy line. As you can see, the market bottoms out even before the recession actually happens. That also happened in the recent case of U.S markets when people were worried about recession. So, this is very important to understand that markets are forward-looking. The bull market starts during the recession itself and that is an indicator of the upcoming booming economy.
During different phases of a cycle, there are different sectors that perform well:
- Early Phase (when recession starts)/Market Bottom: Finance, technology, and Cyclicals
- Full Recession/Bull Market: Technology, Industrials, and Basic Materials
- Market Top: Basic materials, energy, and staples
- Bear Market: Energy, Staples, and Healthcare
- Late Bear Market: Healthcare, Utilities, and Finance
You can see so many examples of sector rotation in Indian markets in the video attached above.
Understanding Ratio Charts for Finding Upcoming Winning Sectors
A ratio chart is a tool to find relative strength. It is also known as the relative Strength chart, which involves a comparison of two trading instruments to find relative outperforming instruments.
Ratio = Numerator/Denominator
- If the ratio line is rising, it means the numerator is outperforming the denominator.
- If the ratio line is falling, it means the denominator is outperforming the numerator.
Various Ways of Finding Relative Strength
- Stock vs stock
- Stock vs sector
- Stock vs Market
- Sector vs Sector
- Sector vs Market
- Asset Class vs Asset Class
In the above video, Suyog Dhavan explains in detail how ratio charts work, how you can analyze them, and how to make decisions by looking at these charts with examples.
Final Thoughts
Understanding sector rotation properly can make your investment journey much smoother. To understand such concepts in further detail, you can refer to the Strategic Alpha YouTube channel or join the Conviction Club by Strategic Alpha, which is a community of like-minded investors where they connect and share ideas with each other.
If you need guidance on how to start your stock market journey, how much capital is enough to begin with, how to do smart investing, or how to take informed stock market decisions, you can join Strategic Alpha’s ‘The Conviction Club’. This is a membership program, especially curated to help investors become aware and knowledgeable about stock market trends, news, and technical aspects, so that they can become their own experts.
Our YouTube channel, weekly webinars, and digital resources available on the website can help you learn the basics of the stock market. For regular updates on trends, one-to-one sessions with experts, and detailed learning modules, you can join the Conviction Club, which is the online community of like-minded investors sharing knowledge and thoughts to grow together.
Subscribe to the Strategic Alpha Newsletter now to get the latest updates about weekly webinars.
Join Me On My Telegram Channel Where I Share Much More Value Adding Knowledge Of Investing/ Trading: Click Here
Also, Don’t Forget To Follow Us On Our Social Media Accounts:
Facebook: https://www.facebook.com/strategicalpha/
Instagram: https://www.instagram.com/strategicalpha/
Twitter: https://twitter.com/suyog_dhavan
YouTube: https://bit.ly/2IIqztO
Disclaimer: Strategic Alpha and Suyog Dhavan are not SEBI-registered investment advisor. The content provided is purely for educational purposes and should not be construed as financial or investment advice. Viewers are encouraged to conduct their own research or consult with a SEBI-registered professional before making any investment decisions.